Understanding journal metrics
Using data to choose a journal for submission
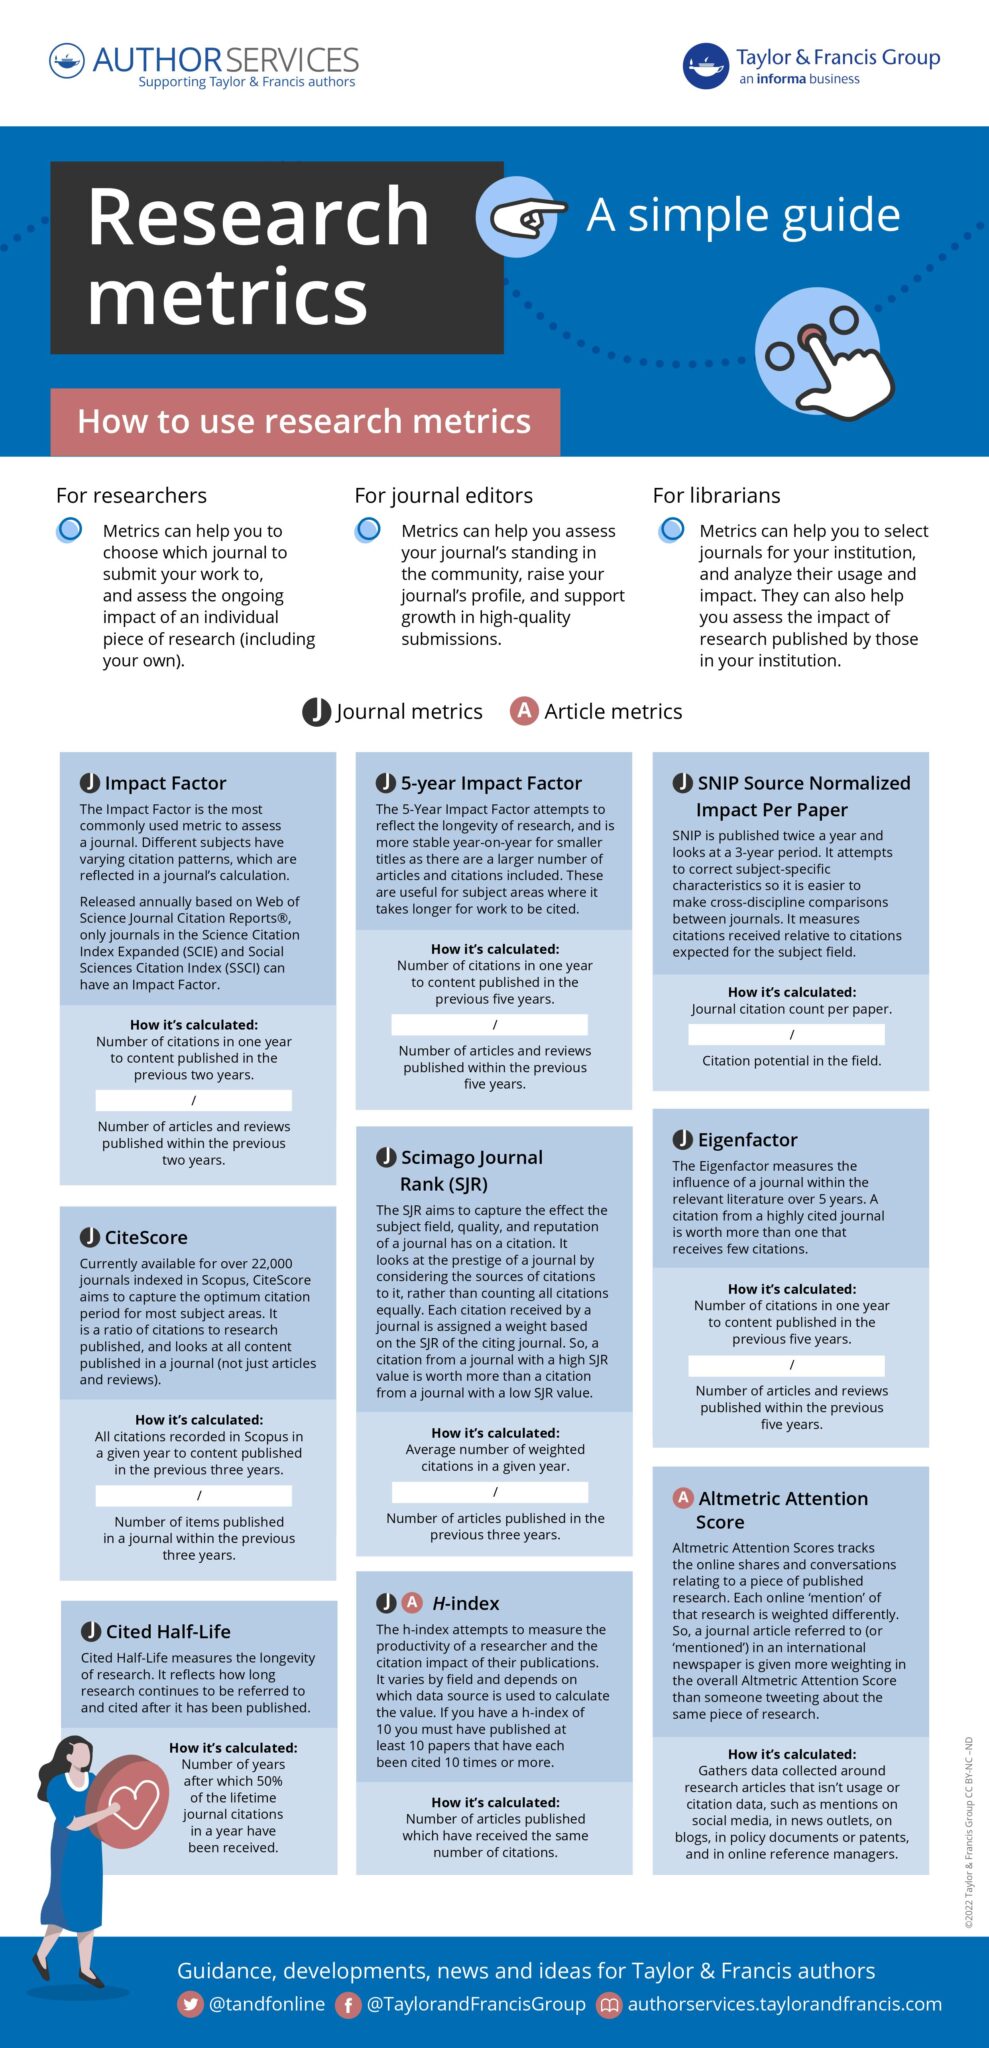
Journal metrics can be a useful quantitative tool for helping you decide where to submit your manuscript. But, any one metric only tells a part of the story, of a journal’s quality and impact.
Each metric has its limitations so should never be considered in isolation.
On this page we cover how to use journal metrics, the different journal metrics you should get familiar with, and frequently asked questions.
Journal metrics each have their limitations, so should never be considered in isolation. Instead, use a few metrics together to reduce bias and make sure that you get a rounded view.
In addition, you must never make a submission decision based solely on publication metrics. There are many other qualitative aspects of a journal you should consider. These include its aims & scope, readership, and the material it publishes.
Above all, you should always be certain that your chosen journal is a good fit for the article you are about to write, otherwise the chances of your article being accepted will be limited. For more details, read the full guide to choosing a journal.
Once your article has been published there are also a range of useful metrics to help you understand its impact and to identify opportunities for future collaboration. Find out how to measure research impact.
Taylor & Francis signed the Declaration on Research Assessment (DORA) which aims to improve the ways in which researchers and the outputs of scholarly research are evaluated.
We firmly believe that researchers should be assessed on the quality and broad impact of their work. While research metrics can help support this process, they should not be used as a quick substitute for proper review.

Once you have a shortlist of journals you are considering submitting to, get a more rounded view of them by looking at the available metrics.
On Taylor & Francis Online navigate to a journal you’re interested in and, in the ‘About this journal’ menu on the left, select ‘Journal metrics’. This will take you to a dashboard displaying a range of available metrics for your chosen journal.
The below images show you the typical journal metrics that are included on Taylor & Francis Online.
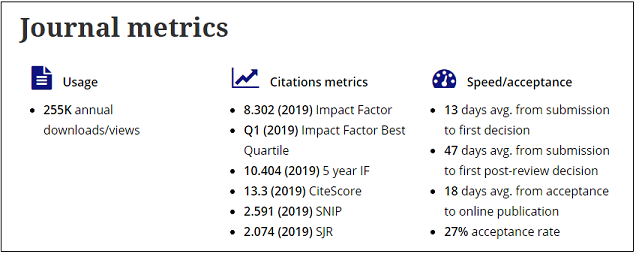
What does it measure?
A journal’s usage is the number of times articles are viewed/downloaded. Gives a quick impression of the journal’s size and reach.
How is it calculated?
The usage figure shown on Taylor & Francis Online is the total number of times articles in the journal were viewed by users in the previous calendar year, rounded to the nearest thousand. This includes all of the different formats available on Taylor & Francis Online, including HTML, PDF, and EPUB. Usage data for each journal is updated annually in February.
What are its limitations?
Larger journals have more usage potential.
Those journals which publish a high number of articles each year and those with a ‘long tail’ of volumes going back many decades offer many more choices to readers. It would therefore be misleading to compare them to a journal which is relatively new or which only publishes a handful of articles each year.
It only includes articles read on Taylor & Francis Online.
There may be several other versions of each article available, such as when an author deposits their open access article in an institutional or subject repository. In addition, some people prefer to read the printed version of a journal, which won’t be included in this figure.
Downloading an article is not the same as reading it.
How many times have you downloaded an article which you didn’t then find the time to read?
Citation metrics aim to assess the academic impact of a journal by measuring how often its articles are included in the reference lists of other publications.
If your primary goal is for other scholars to read and use your research, then citation metrics can give you an idea of whether the journal you are interested in is widely read by this group.
When considering any citation metric, you should be aware that:
Citations are not necessarily a measure of quality.
A citation only tells you that a researcher has chosen to reference another scholarly work in their article or book. However, you would need to understand the context of that citation to judge whether it is a positive one. Articles are sometimes cited by an author to reference theories or findings which they believe are incorrect or outdated.
Citation patterns vary by discipline.
In some subject areas it is common to cite a large number of relevant publications, whereas in others a limited list of references is more normal. You should also be aware that articles in some subjects, such as the arts and humanities, typically continue to be cited for many more years than in areas like science and medicine, which prioritize building on the most recent research.
Citations vary by article type.
For example, review articles which give a broad overview of a research topic are often highly cited. In contrast, a research article which is reporting null results, although an important addition to the scholarly record, may be cited very little.
Subject matter will also affect citations.
An article which is on a subject of wide interest or is especially topical, is likely to receive a high number of citations. In contrast, a highly specialized article in a small field may attract very few citations, regardless of the quality of its scholarship.
Citation levels may be influenced by a journal’s readership.
Journals that are aimed primarily at practitioners, policy makers, or members of the public are far less likely to receive citations in other scholarly publications, though their content may have broad impact.

Any judgement of a journal based on the following citation metrics should therefore always consider its subject area, readership, and the types of article it publishes.
Impact Factor* (two-year Impact Factor)
What does it measure?
The Impact Factor is the average number of citations received by articles in a journal within a two-year window. So, if the journal has an Impact Factor of 1, in a given year articles published in the previous two years will typically receive one citation each.
How is it calculated?
Number of citations received in one year to content published in Journal X during the two previous years, divided by the total number of articles and reviews published in Journal X within the previous two years.
For example, the 2019 Impact Factors (released in 2020) used the following calculation: Number of citations received in 2019 to content published in Journal X during 2017 and 2018, divided by the total number of articles and reviews published in Journal X in 2017 and 2018.
Impact Factors are published annually by Clarivate in the Web of Science Journal Citation Reports® (JCR).
What are its limitations?
Although the Impact Factor is probably the most well-known journal metric and is frequently misused as a proxy for journal and article quality, there are many reasons why it should not be considered in isolation.
In addition to the limitations of all citation metrics listed above, when using the Impact Factor, you should be aware that:

In some subjects, two years is a very short timescale in which to judge the impact of research article. There are disciplines which place less emphasis on rapid responses to recently published research and in which articles can continue receiving citations many years or even decades after publication.
The Impact Factor is an arithmetic mean and doesn’t adjust for the distribution of citations. One highly-cited article can therefore have a major positive effect on the Impact Factor, skewing the result for the two years.
Citations are only included if they appeared in a journal listed in the Citation Indexes. These are selective indexes, including approximately 11,000 journals, and will therefore not represent all of the citations.
It doesn’t distinguish between citations made to articles, reviews, or editorials. So that the Impact Factor doesn’t penalize journals that publish rarely-cited content like book reviews, editorials, or news items, these content types are not counted in the denominator of the calculation (the total number of publications within the two-year period).
However, citations to this kind of content are still counted. If such articles are cited, they increase the Impact Factor without any offset in the denominator of the equation.Impact Factors can show significant variation year-on-year. This is especially true for smaller journals. Since Impact Factors are average values, they vary year-on-year due to random fluctuations. This change is related to the journal size (the number of articles published per year): the smaller the journal, the larger the expected fluctuation.
Not every journal has an Impact Factor
There are several reasons why a journal might not have an Impact Factor:
Journals listed in the Science Citation Index Expanded® (SCIE) and Social Sciences Citation Index® (SSCI) receive an Impact Factor. For the first time with the publication of the 2022 Impact Factors, journals indexed in Arts and Humanities Citation Index (AHCI) and the Emerging Sources Citation Index (ESCI) will receive Impact Factors.
The journal may still be under consideration for inclusion in the Citation Indexes.
Clarivate may have chosen not to list the journal. Non-inclusion may not necessarily be related to the journal’s quality but perhaps because it focuses on research published in a single region.
New journals, even if they have already been accepted into the Citation Indexes, won’t have had a long enough publication history for an Impact Factor to be calculated.
The publisher may have chosen not to submit the journal for consideration.
Impact Factor* Best Quartile
What does it measure?
The annual Journal Citation Reports (JCR), published by Clarivate, separate journals into subject categories and a single journal can be listed in more than one category. The journals in each category are ranked according to their Impact Factor. This metric indicates a journal’s ranking in its best performing category.

How is it calculated?
The journal’s highest subject category ranking in the Journal Citation Reports. Quartile 1 (Q1) = the 25% of journals with the highest Impact Factors in that category.
What are its limitations?
All of the limitations of the two-year Impact Factor apply to this metric.
Additionally, although there are over 200 different categories in the JCR, some journals will be listed in broad categories alongside journals representing sub-fields which have very different citation patterns. Therefore, a journal which is highly cited relative to other publications in its specialist field may still have a low ranking in its JCR category.
5-Year Impact Factor
What does it measure?
The 5-Year Impact Factor is a modified version of the Impact Factor, using five years’ data rather than two. A journal must be covered by the JCR for five years or from Volume 1 before receiving a 5-Year Impact Factor.

How is it calculated?
Number of citations in one year to content published in Journal X during the previous five years, divided by the total number of articles and reviews published in Journal X within the previous five years.
What are its limitations?
The 5-Year Impact Factor is more useful for subject areas where it takes longer for work to be cited, or where research has more longevity. It offers more stability for smaller titles as there are a larger number of articles and citations included in the calculation. However, it still suffers from many of the same issues as the 2-year Impact Factor and those common to all citation metrics (see above).
CiteScore*
What does it measure?
CiteScore measures the average number of citations received per peer-reviewed article published in a journal or book series. It applies to titles indexed in Scopus and includes articles, reviews, conference papers, data papers, and book chapters.
How is it calculated?
CiteScore is calculated by dividing the number of citations in the last four complete years (to peer-reviewed articles published in Journal X) by the total number of peer-reviewed articles published in Journal X during the same period.
What are its limitations?
In addition to the limitations of all citation metrics listed above, CiteScore is based on the Scopus database. Although its coverage is wider than some other indexes, Scopus is selective as to which journals are included. This means there will be some references that aren’t considered.
Additionally, CiteScore is an arithmetic mean and doesn’t adjust for the distribution of citations. A few highly-cited articles can therefore skew the overall figure.
CiteScore* Best Quartile
What does it measure?
Scopus separates journals into subject area categories and a single journal can be listed in more than one category. The journals in each category are ranked according to their CiteScore. This metric indicates a journal’s ranking in its best performing category.
How is it calculated?
The highest ranking the journal has in a Scopus subject category. Quartile 1 (Q1) = the 25% of journals with the highest CiteScores in that category.

What are its limitations?
All of the limitations of the CiteScore apply to this metric.
Additionally, although there are over 300 different categories in Scopus, some journals will be listed in broad categories alongside journals representing sub-fields which have very different citation patterns. Therefore, a journal which is highly cited relative to other publications in its specialist field may still have a low ranking in its Scopus category.
Source Normalized Impact per Paper (SNIP)
What does it measure?
SNIP measures citations received by articles in the journal against citations expected for the subject field, using Scopus data. SNIP is published twice a year and looks at a three-year period.

How is it calculated?
The number of citations per paper in the journal, divided by citation potential in the field.
The citation potential is defined using the set of publications citing that journal. This means that if an article receives a citation in a subject where citations are less common, that citation will be given a higher value.
What are its limitations?
SNIP normalizes its sources to allow for cross-disciplinary comparison. In practice, this means that a citation from a publication with a long reference list has a lower value.
It doesn’t count citations from publications classified as “non-citing sources”. These include trade journals and many arts and humanities titles.
It’s based on data in the Scopus database. Some references won’t therefore be considered.
Scimago Journal Rank (SJR)
What does it measure?
The SJR aims to capture the effect of subject field, quality, and reputation of a journal on citations. It calculates the prestige of a journal by considering the value of the sources that cite it, rather than counting all citations equally.
How is it calculated?
Each citation received by a journal is assigned a weight based on the SJR of the citing journal. So, a citation from a journal with a high SJR value is worth more than a citation from a journal with a low SJR value.
The SJR calculation is the average number of (weighted) citations in a given year to Journal X, divided by the number of articles published in Journal X in the previous three years.
What are its limitations?
It’s based on data in the Scopus database. Some references won’t therefore be considered.

* Impact Factor, 5-Year Impact Factor, and Journal Citation Reports®, are copyright Clarivate Analytics
* CiteScore™ is a trademark of Scopus®
The following speed metrics, which are available for many journals on Taylor & Francis Online, indicate how long different stages of the publishing process might take. These metrics are only a guide, not a guarantee, and you should consider the following points.
These are median figures.
This means that some articles will be processed in less time than shown, while for others it may take much longer.Current figures include pandemic impact.
As for most areas of life, COVID-19 has significantly affected some individuals and journal processes. The speed data currently presented may therefore not represent a journal’s performance in a typical year.Journals with fewer than 10 articles are not included.
To make sure that we only display meaningful data, we do not publish speed metrics for journals that made fewer than 10 first decisions or published fewer than 10 articles in the last calendar year.Accelerated publication articles are excluded.
A small number of medical journals offer an expedited peer review process, to coordinate publication with drug approvals or launches. Articles using these options are not included in the journal’s speed metrics.

The speed metrics published on Taylor & Francis Online are for the previous six months and are updated in February and July.
If speed of publication is especially important for your article, you may also wish to consider submitting your work to F1000Research. This platform operates a post-publication peer review model, which means submitted articles are published online in a fully citable format in just 14 days.
Speed to first decision and first post-review decision
These metrics can help to give you an idea of how long it can take after submitting your article before you receive the editor’s first decision. When considering these data you should remember that:
Submission volumes may impact decision times.
Journals may sometimes take longer to process submissions if there are high volumes, especially when the flow of submissions varies throughout the year.Availability of reviewers varies.
These metrics include the time it takes for an editor to find experts who are willing and able to review. For example, it may take longer for editors of broad-focus journals to find reviewers in topics outside of their own expertise. In specialist fields, where only a limited number of potential peer reviewers is available, authors may also have to expect longer peer review times. This is because demand on the experts’ available time for reviewing is even greater than usual.Longer decision times may hide other valuable editorial activities.
For example, a journal may have longer turnaround times because of the extra support and mentoring it gives to researchers to improve their paper. This is often the case for journals which receive many submissions from researchers who don’t have English as their first language.Some article types might not be included.
A number of journals don’t currently process all of their articles using the online submission systems that these data are taken from. This might include opinion pieces, editorials, and debates.
Speed from submission to first-decision
What does it measure?
This metric indicates how long after submission it may take before you receive a decision about your article.
How is it calculated?
This is the median number of days from submission to first decision for all manuscripts which received a first decision in the previous six months.
What are its limitations?
In addition to the limitations of speed metrics listed above, journals don’t all peer review the same proportion of articles.
Journals which reject a high percentage of submitted articles without sending them for peer review (desk rejections) will have a shorter average decision time than those which peer review most submissions. In fact, journals with high desk-rejection rates may even have an average decision speed as low as ‘0 days’ if they typically make a desk-reject decision on the day of submission.
Authors of articles that are sent out for review can therefore have much longer wait than this metric indicates, if a high proportion of manuscripts submitted to the journal are desk rejected.

Speed from submission to first post-review decision

What does it measure?
This metric only considers those articles that are sent out for peer review by experts in the field. It indicates how long it may take before you receive a decision on your peer reviewed article.
How is it calculated?
This is the median number of days from submission to decision for all peer reviewed articles which received a first decision in the previous six months.
What are its limitations?
It’s not widely available. Many other publishers only display the ‘to first decision’ metric, which means you need to ensure you are comparing like with like when using these data.
Speed from acceptance to online publication
What does it measure?
This metric tells you about the journal’s production speed, indicating how long you are likely to wait to see your article published online once the journal’s editor has accepted it.
How is it calculated?
On Taylor & Francis Online this figure is the median number of days from acceptance to online publication of the Version of Record, for articles published in the previous six months.
What are its limitations?
Special issue articles may be held back.
Some journals prefer to publish all articles in a special issue at the same time, so that they can be considered together. This may therefore mean that special issue articles which are accepted first will have a longer wait.Some journals make the Accepted Manuscript available first.
In subjects where speed of availability is especially important, a number of journals have chosen to make the accepted manuscript version of articles available on Taylor & Francis Online until publication of the definitive Version of Record. However, the posting of this earlier version is not reflected in the publication speed metric.This period may include more than just the publication process
Once a journal has accepted a manuscript, there may then be additional support given to the author to further improve their article before the production process begins. For example, this might include help with improving language clarity.
What does it measure?
A journal’s acceptance rate is an indication of the number of submissions it receives for every article that’s eventually published. The acceptance rate is often considered a proxy for quality, given that the most prestigious journals tend also to be highly selective.
There is also often a correlation with scope, as publications aimed at a broader readership may also attract a higher number of submissions. However, when making your submission decision, you should also consider who your intended readership is. If you want to reach peers in your specialist field, then it may not be necessary to submit to a highly selective journal.
The acceptance rates published on Taylor & Francis Online are for the previous full calendar year and are updated in February.
How is it calculated?
This figure represents the articles accepted by the journal for publication in the previous calendar year as a percentage of all papers receiving a final decision in that calendar year. It includes all article types submitted to the journal, including those that are rejected without being peer reviewed (desk rejects).
What are its limitations?
In addition to the considerations above about how useful acceptance rates might be for choosing a journal to submit to, you should also be aware that:
Acceptance rates vary by article type.
For example, original research articles will often have a higher rejection rate than commentaries and book reviews.Special issue articles usually have higher acceptance rates.
This may, for example, be because the guest editor has invited selected authors to submit the papers they presented at a conference.Journals with fewer than 10 articles are not included.
To make sure that we only display meaningful data, we do not publish acceptance rates for journals that made fewer than 10 final decisions in the last calendar year.

As for all journal metrics, the acceptance rate should never be the main reason you choose to submit to a particular journal. Even if a journal’s acceptance rate is very high, your article still won’t be successful if it’s unsuitable for that journal. You should therefore only take acceptance rates into account once you have a shortlist of possible journals based on other qualitative factors.
Why is the journal I’m interested in not displaying any metrics on Taylor & Francis Online?
There are a few journals which do not currently display any metrics:
New journals: if a title has only recently begun publishing there will not be enough data for us to display meaningful figures.
Journals that are new to Taylor & Francis: we may not always have historical data for journals which have recently joined Taylor & Francis.
Why do some journals on Taylor & Francis Online not display some or any of the citation metrics?
We aim to publish all of the citation data that are available. However, as explained above, some citation metrics are not given to every journal. For example, the Impact Factor* is only calculated for journals listed in the Science Citation Index and the Social Sciences Citation Index.
Why do some journals not display the speed and acceptance metrics on Taylor & Francis Online?
In consultation with our editors and society partners, we have decided not to display the speed and acceptance metrics for some journals at the current time. This will be reviewed regularly and may be because of one or more of the following reasons:
Data does not accurately represent current performance. For example, the speed of decision making in the previous year may have been negatively impacted by editorial transition or health reasons. We have been very grateful for the understanding authors have shown when the Covid-19 pandemic has made prompt peer review and production times more difficult for some journals. Other journals have recently implemented workflow improvements which mean turnaround times are now much faster than in the previous year.
Too few articles published. We have chosen not to publish the speed metrics or acceptance rate for journals which made fewer than ten final decisions in the last calendar year.
High number of special issues makes the figures misleading. At the current time we are unable to exclude data for articles published in special issues. These articles may have higher acceptance rates, such as when authors of conference papers are invited to submit by the guest editor. In these cases, it would be misleading to suggest that unsolicited articles have the same acceptance rate.
Some journals are ‘off system’. Decision speeds and acceptance data are taken from our advanced submission systems. While the majority of journals already use these systems to manage their review processes, there are still a few which are in transition and therefore don’t yet have robust enough figures for us to display.

Why do some journals have a submission to first decision speed of ‘0 days’?
This metric is the median number of days it takes for all manuscripts to receive a first decision after they’ve been submitted. Some journals reject a high percentage of the papers they receive without sending them out for peer review (‘desk rejections’). If a journal in this category is very efficient, and typically makes desk-rejection decisions on the same day that a paper is submitted, then the average decision speed can be less than a day. In these cases the ‘speed from submission to first post-review decision’ is a useful additional metric, which indicates how long it may take before you receive a decision if your article is selected to be peer reviewed.
Why isn’t there a speed metric for submission to publication?
The aim of the speed metrics is to be transparent about those stages which a journal’s editor, reviewers, and publisher have control or influence over. However, the full publishing process also includes those stages that are in your hands, as an author. For example, once you have received a first revise-and-resubmit decision, it is up to you how long you then take to make any changes in light of the reviewers’ comments before sending it back.
How to measure research impact
The Author Services guide to article-level metrics, featuring usage, citations, and Altmetric Attention Scores.
Understanding research metrics
A guide for journal editors, with advice on using metrics to measure journal performance.
Open access journals and Impact Factors
Find out why open access journals may (or may not) have Impact Factors and how to use different metrics when choosing an open access journal to publish in.
The Declaration on Research Assessment (DORA)
DORA recognizes the need to improve the ways in which researchers and the outputs of scholarly research are evaluated.
Journal Suggester
The Journal Suggester uses artificial intelligence to match the subjects covered in your article to related content across the corpus of over 4.5 million articles on Taylor & Francis Online.
Taylor & Francis Journal Suggester
A simple guide on how to use research metrics
A comprehensive guide on choosing the right journal